AI Agent effectiveness
You can view how effective your AI Agent is in the AI Agent effectiveness section.
Coverage
The Coverage chart shows the percentage of conversations for which an AI Agent didn't trigger the Unknown
node in the dialog. For example, in the following graph, you can see that 83% of the conversations were covered. This means that for those conversations, an Unknown node was never triggered. You can also see the percentage and the absolute number of the conversations the assistant covered by hovering your cursor over the respective bar.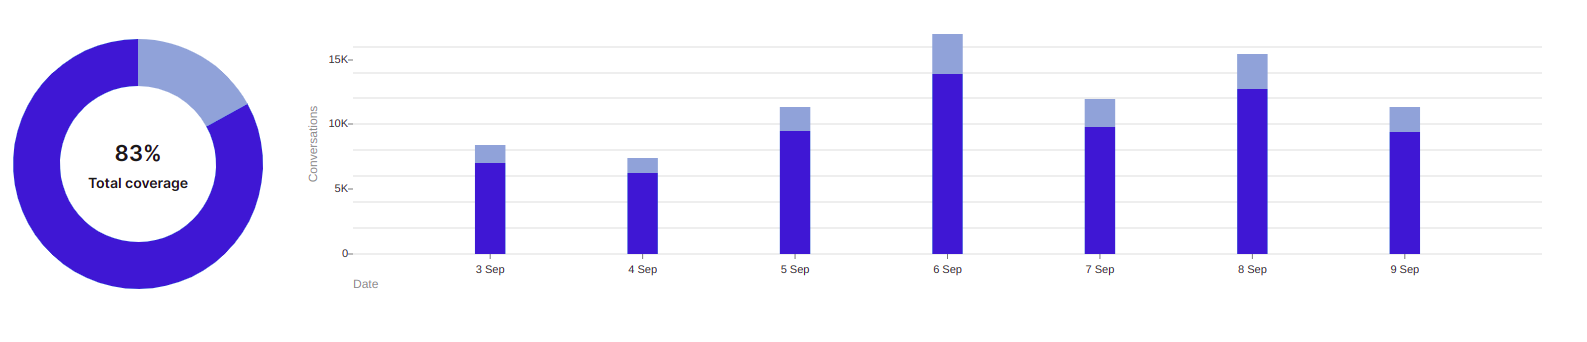
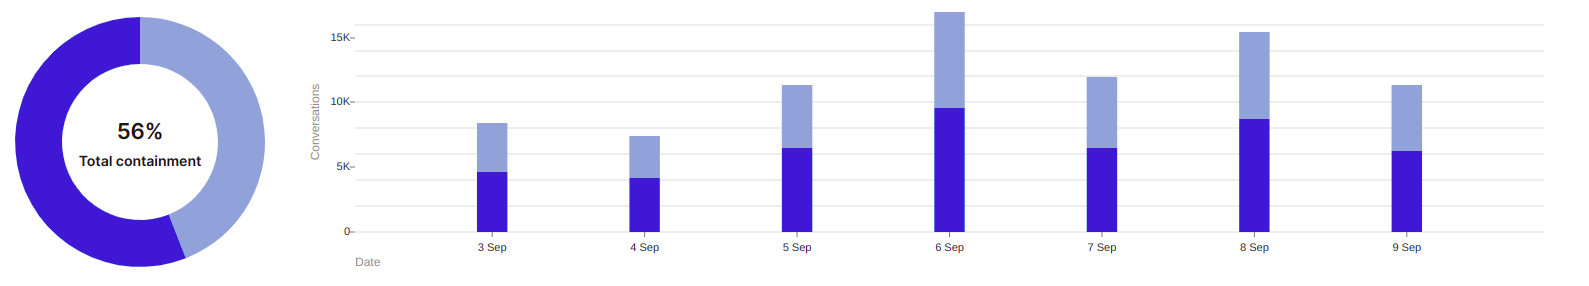
Containment
The Containment graph shows the percentage of conversations that were not handed over to a live agent. In blue, you can see the contained conversations, those that concluded without the need for human intervention. You can also see the percentage and the absolute number of the conversations the assistant covered by hovering your cursor over the respective bar.