Customer satisfaction
The Customer satisfaction section helps you gather information about how happy your end users are with their interactions with your team, including the AI Agent and live chat agents.
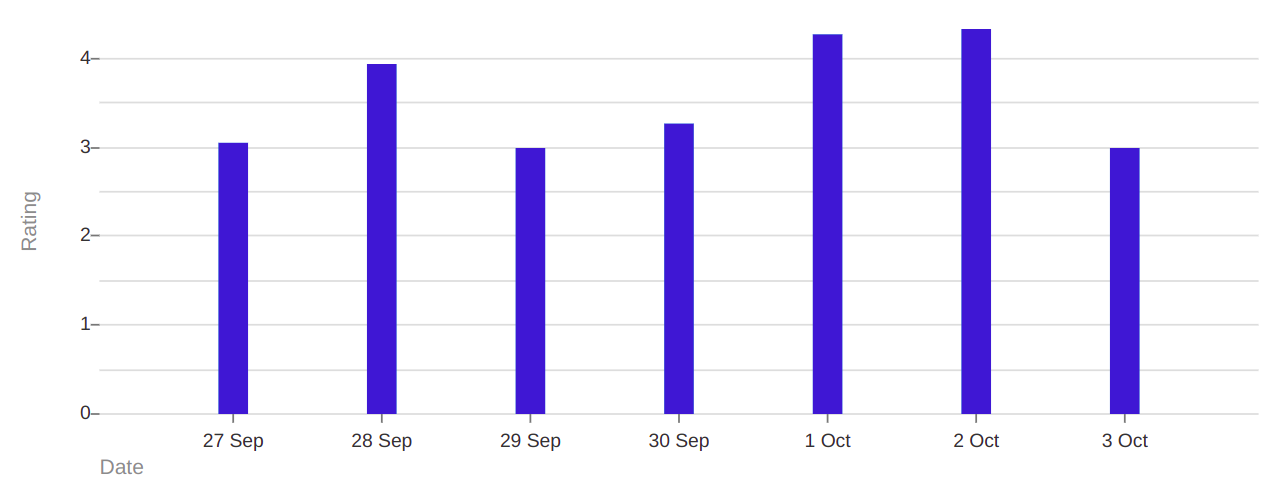
Rating
The Rating by day graph displays the average or median rating that customers give to sessions per day.
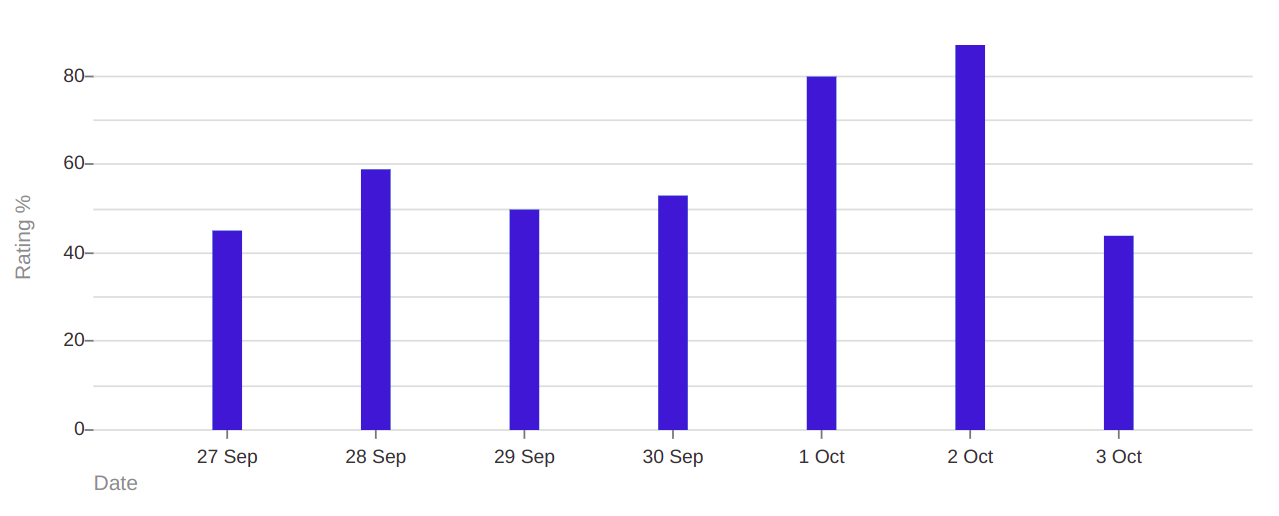
Rating percentage of more than three stars
The Rating percentage of more than three stars graph shows the percentage of sessions in which users give a rating of more than three stars (out of a maximum of five) per day.
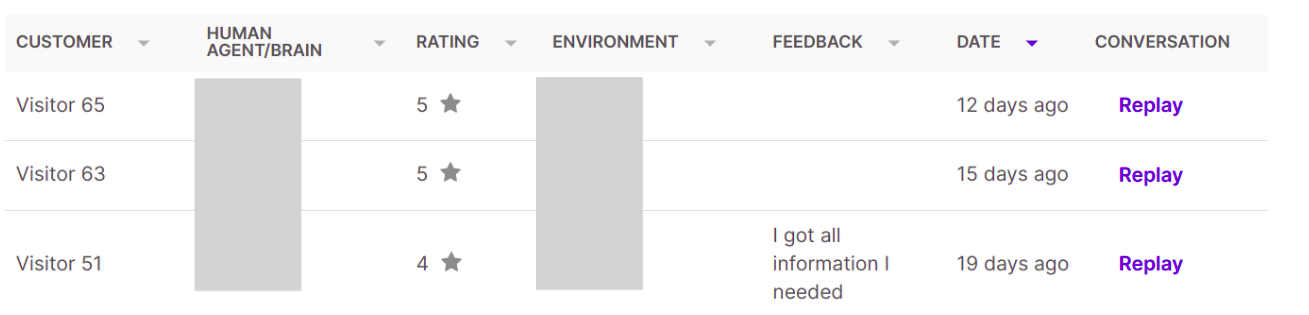
Remarks from customers
You can also view any remarks your customers provide via the Remarks from customers table. This table displays all conversations in which the user left a rating and/or feedback. You can filter out higher ratings to view conversations that left users unhappy and replicate each one using the Replay functionality. You can learn more about that functionality in the Logs
section.