AI Agent effectiveness
The AI Agent effectiveness section shows how well your AI Agent handles conversations.
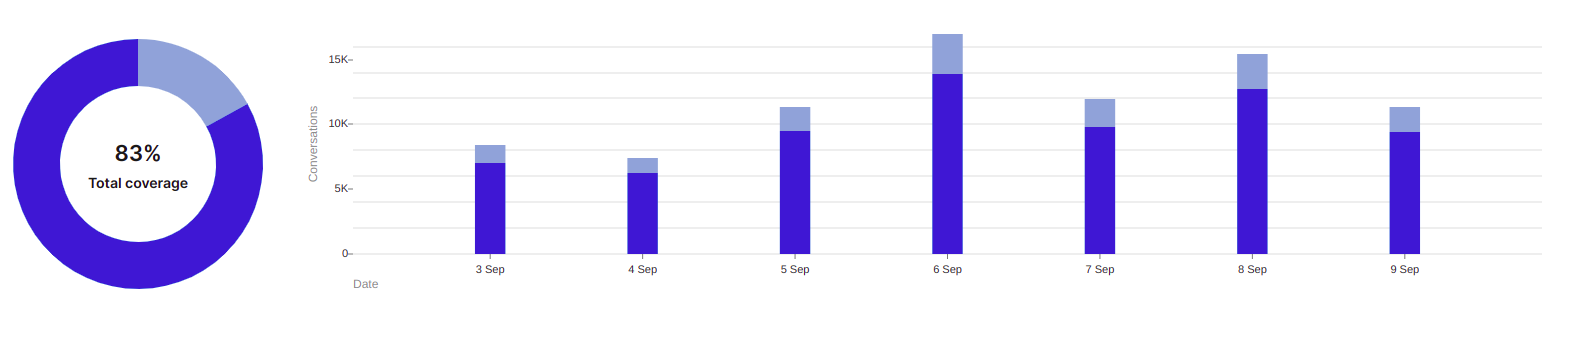
Coverage
The Coverage chart shows the percentage of conversations where the AI Agent did not trigger the Unknown node. In this example, 83% of conversations were covered, meaning the Unknown node never triggered. Hover over any bar to see the percentage and absolute count.
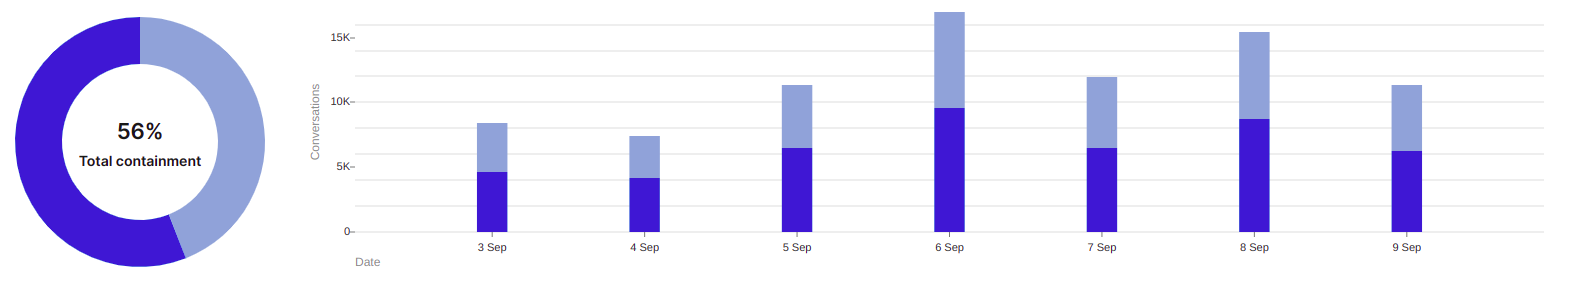
Containment
The Containment graph shows the percentage of conversations that did not require a live agent handover. Blue bars represent contained conversations that concluded without human intervention. Hover over any bar to see the percentage and absolute count.