Live agent effectiveness
The Live agent effectiveness section shows response time statistics for your live agents. Filter by environment or individual agent.
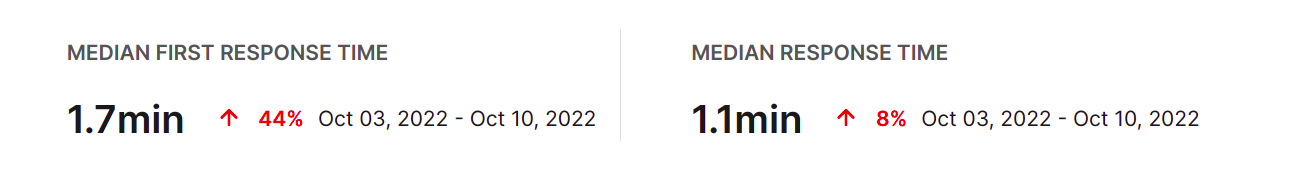
Live agent responsiveness
The Live agent responsiveness graph shows first response time and general response time. Choose between average, median, maximum, or minimum values. Compare data to the previous time period.
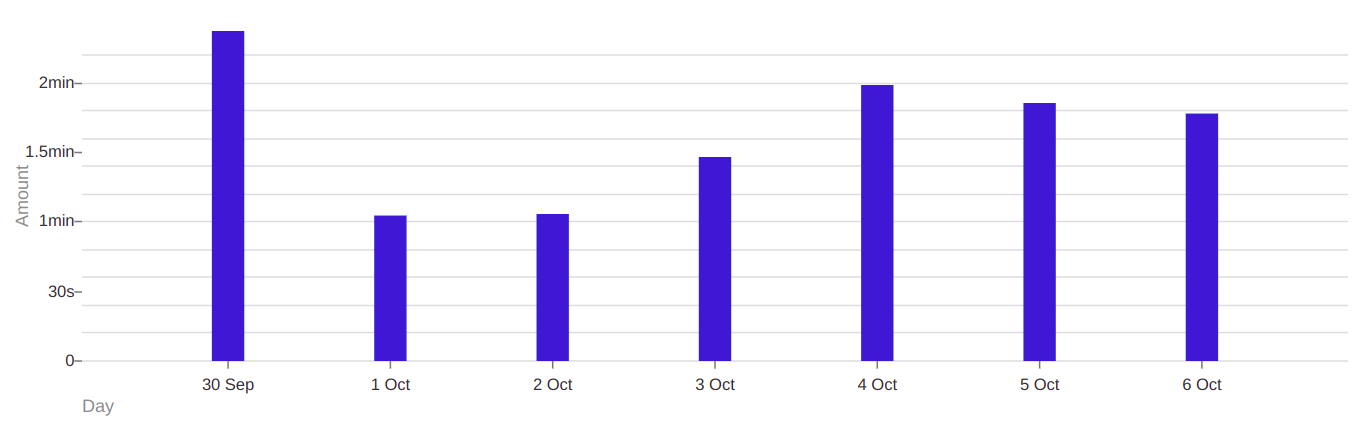
First response time
The First response time graph provides data about the first response time to a message. The first response time is defined as the elapsed time between the user's first message and the agent's response.
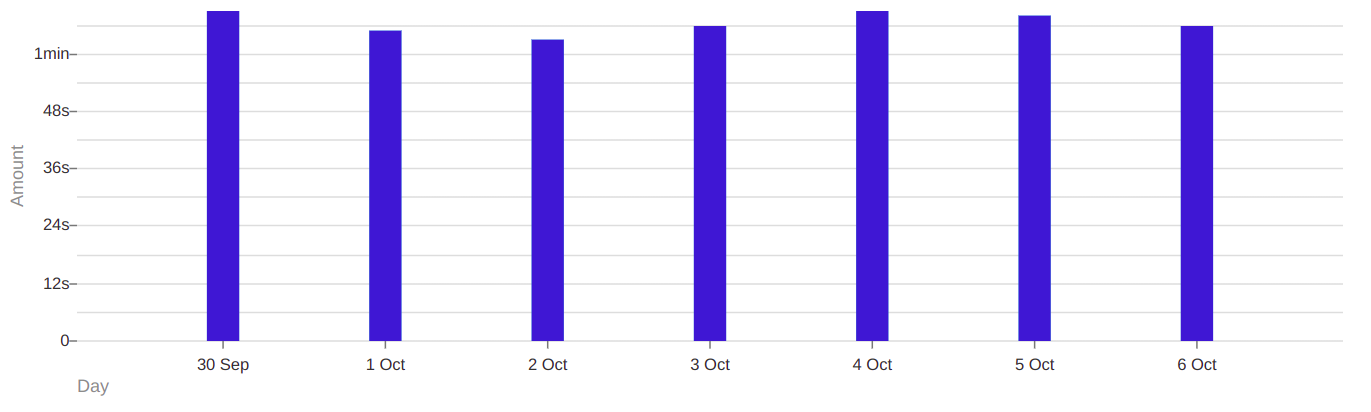
Response time
The Response time graph provides data about the general response time to a message, which is the time taken for a live agent to reply to a message, without considering if it is the first message.
Use the median when extreme values are present, and the average otherwise.