Usage
The Usage section shows AI Agent activity for a specific time interval. Three graphs display key metrics.
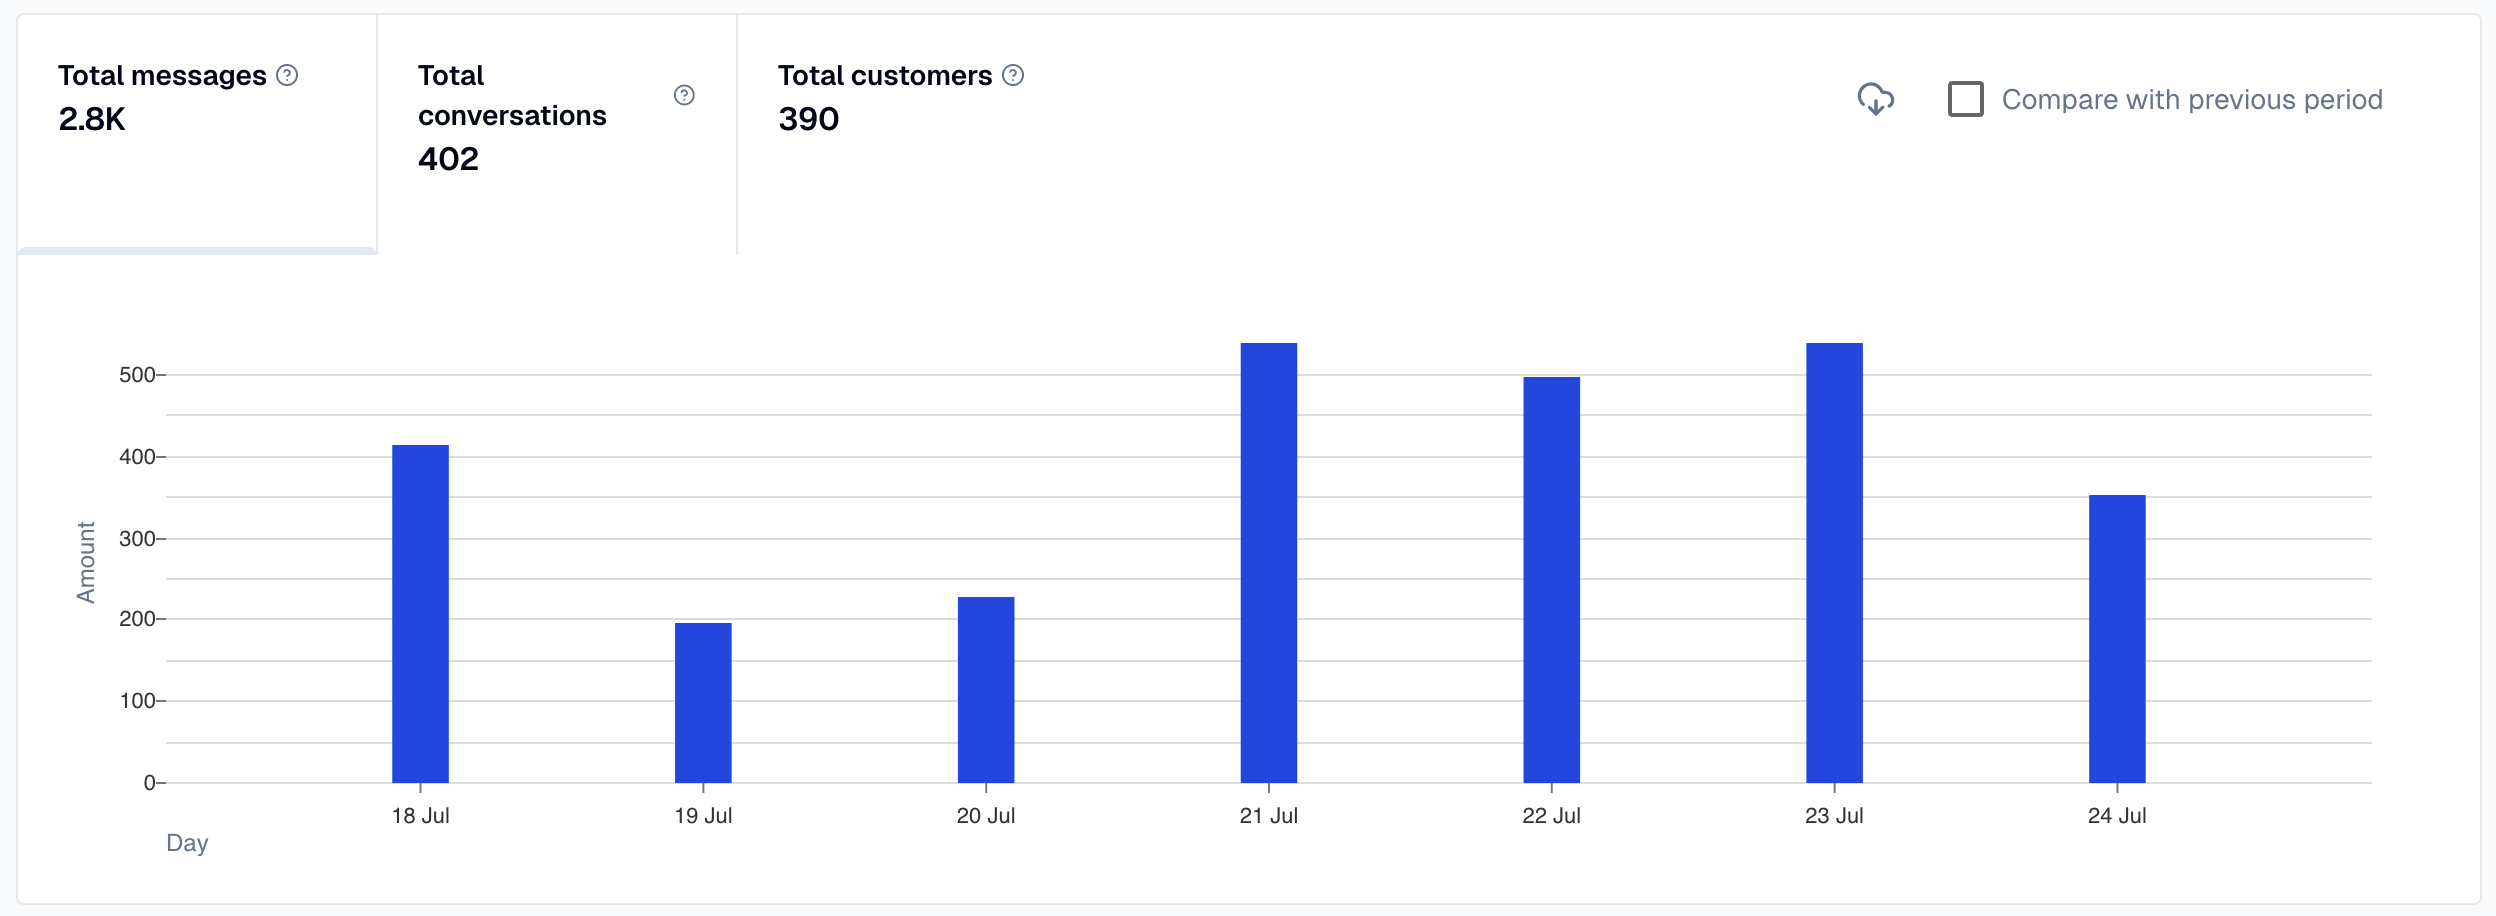
Counts
The Counts graph shows messages, conversations, and customers for the selected time period. Enable comparison to see the previous period as gray bars alongside current data, with percentage changes displayed.
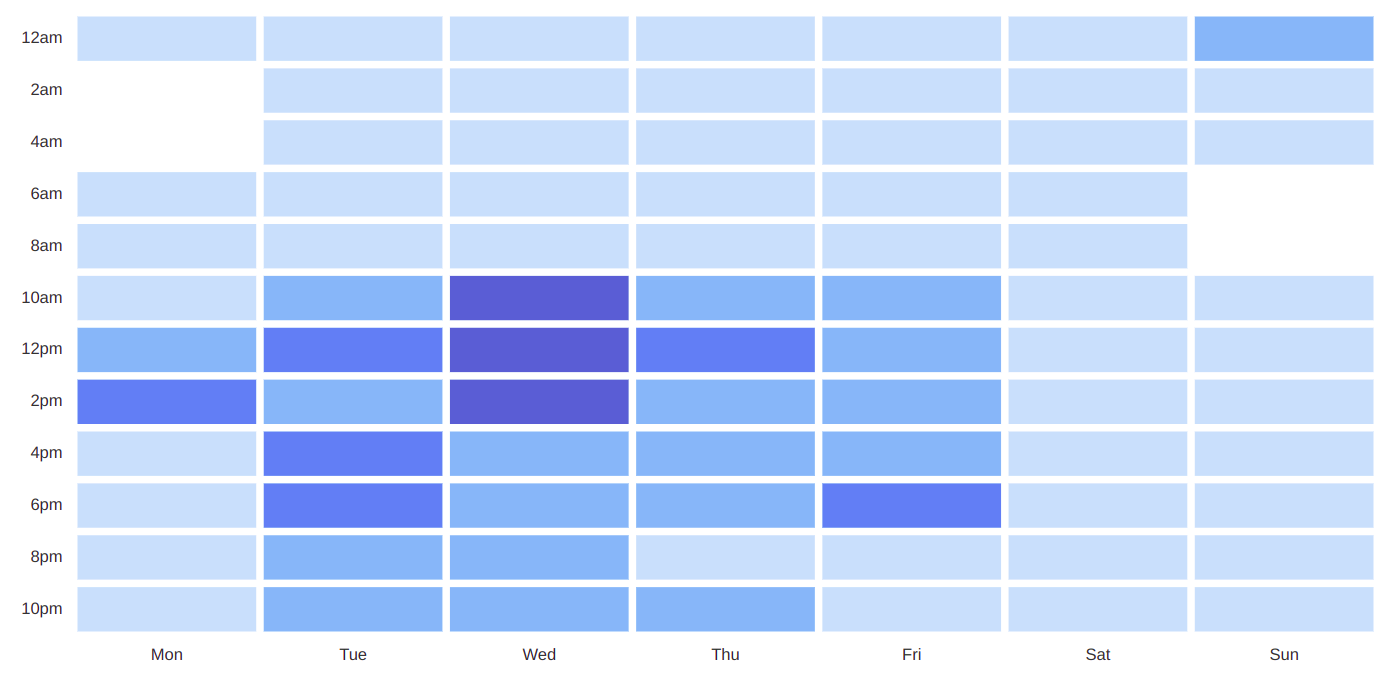
Messages by time of day
The Messages by time of day graph shows message volume during specific time intervals. Use this to identify peak hours. For example, high volume between 10 AM and 2 PM on Wednesdays suggests scheduling live chat coverage during that period. Hover over any cell to see exact counts.
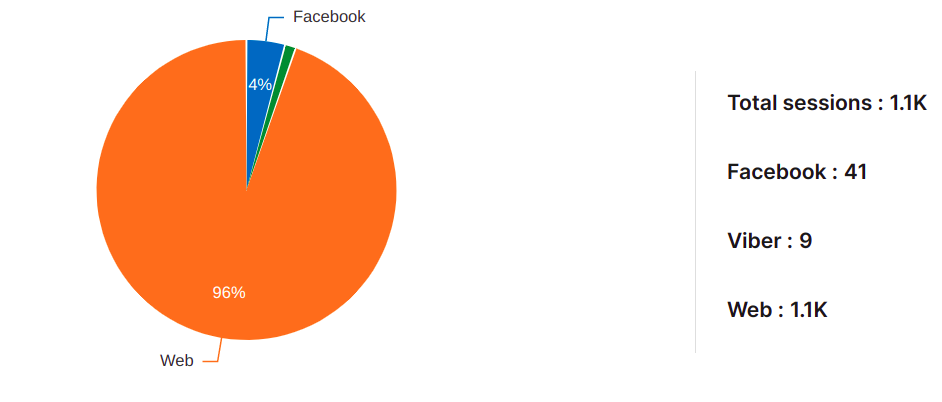
Conversations per channel
The Conversations per channel graph shows conversation distribution across channels. Identify which channels (Web, Facebook, Viber, etc.) users prefer for contacting your AI Agent.